Elements
Data and charts
Tables, charts, progress, live metrics, revenue cards, and structured data views.
Data and charts
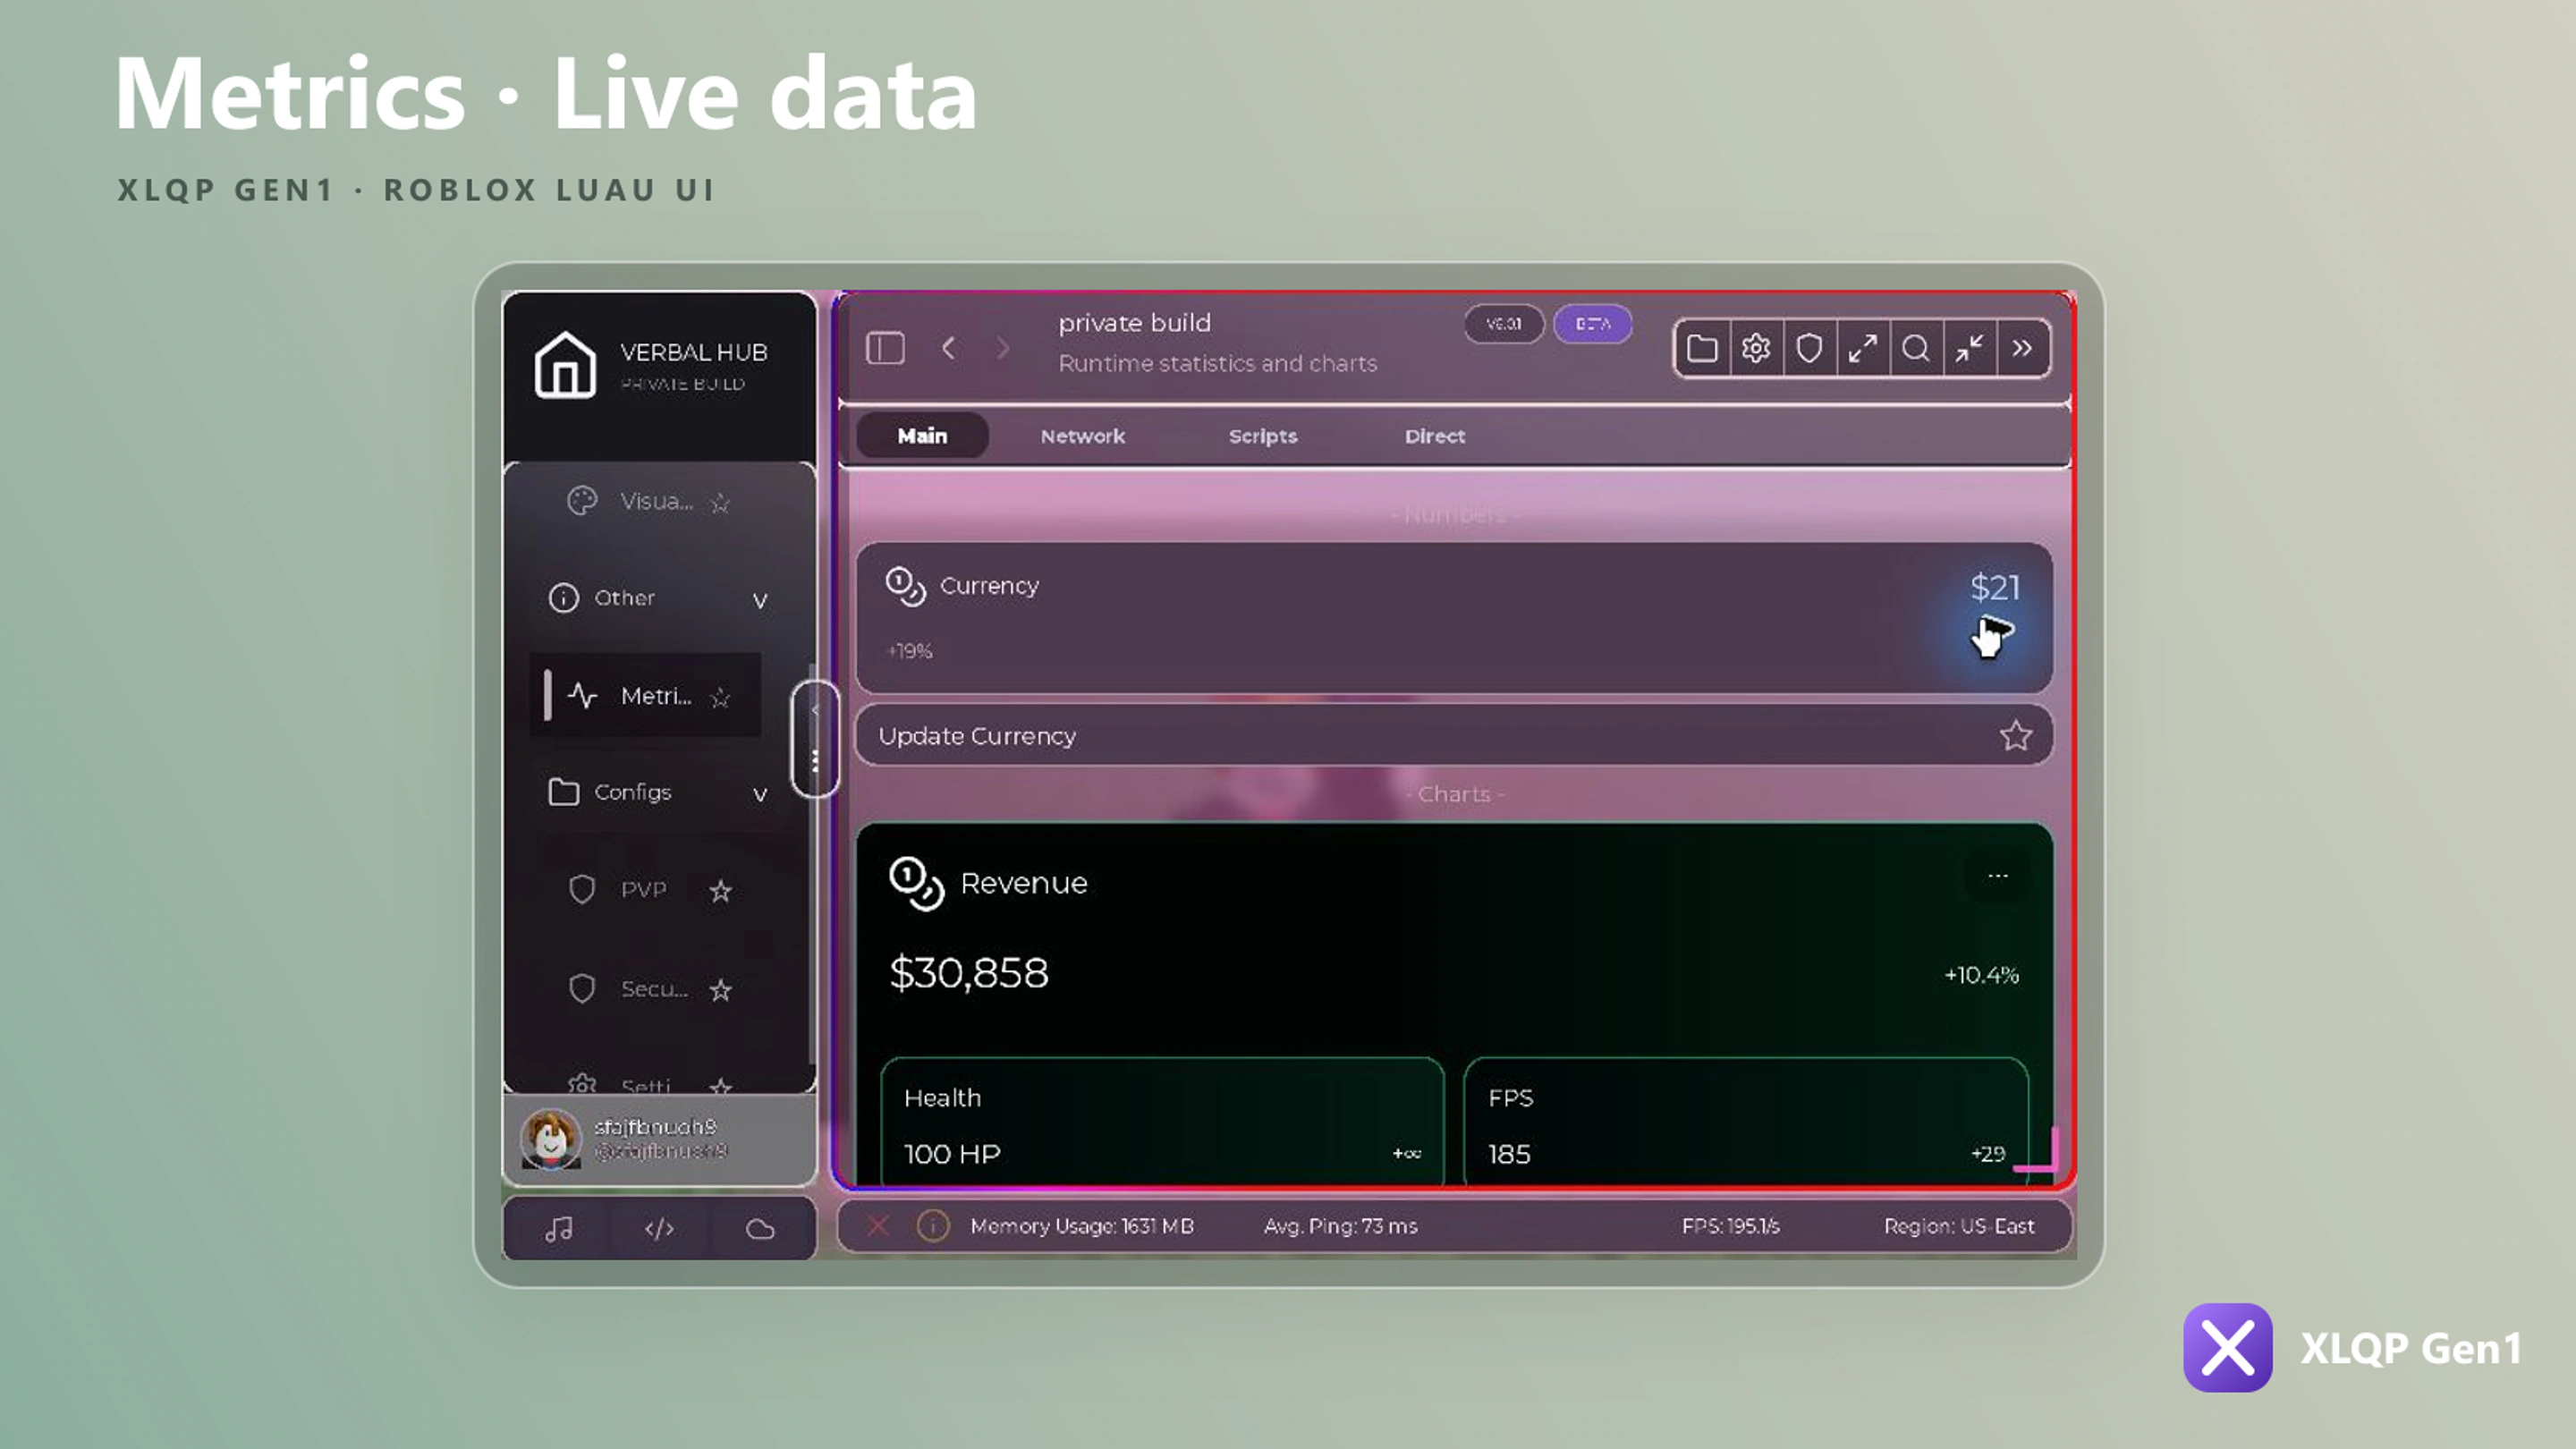
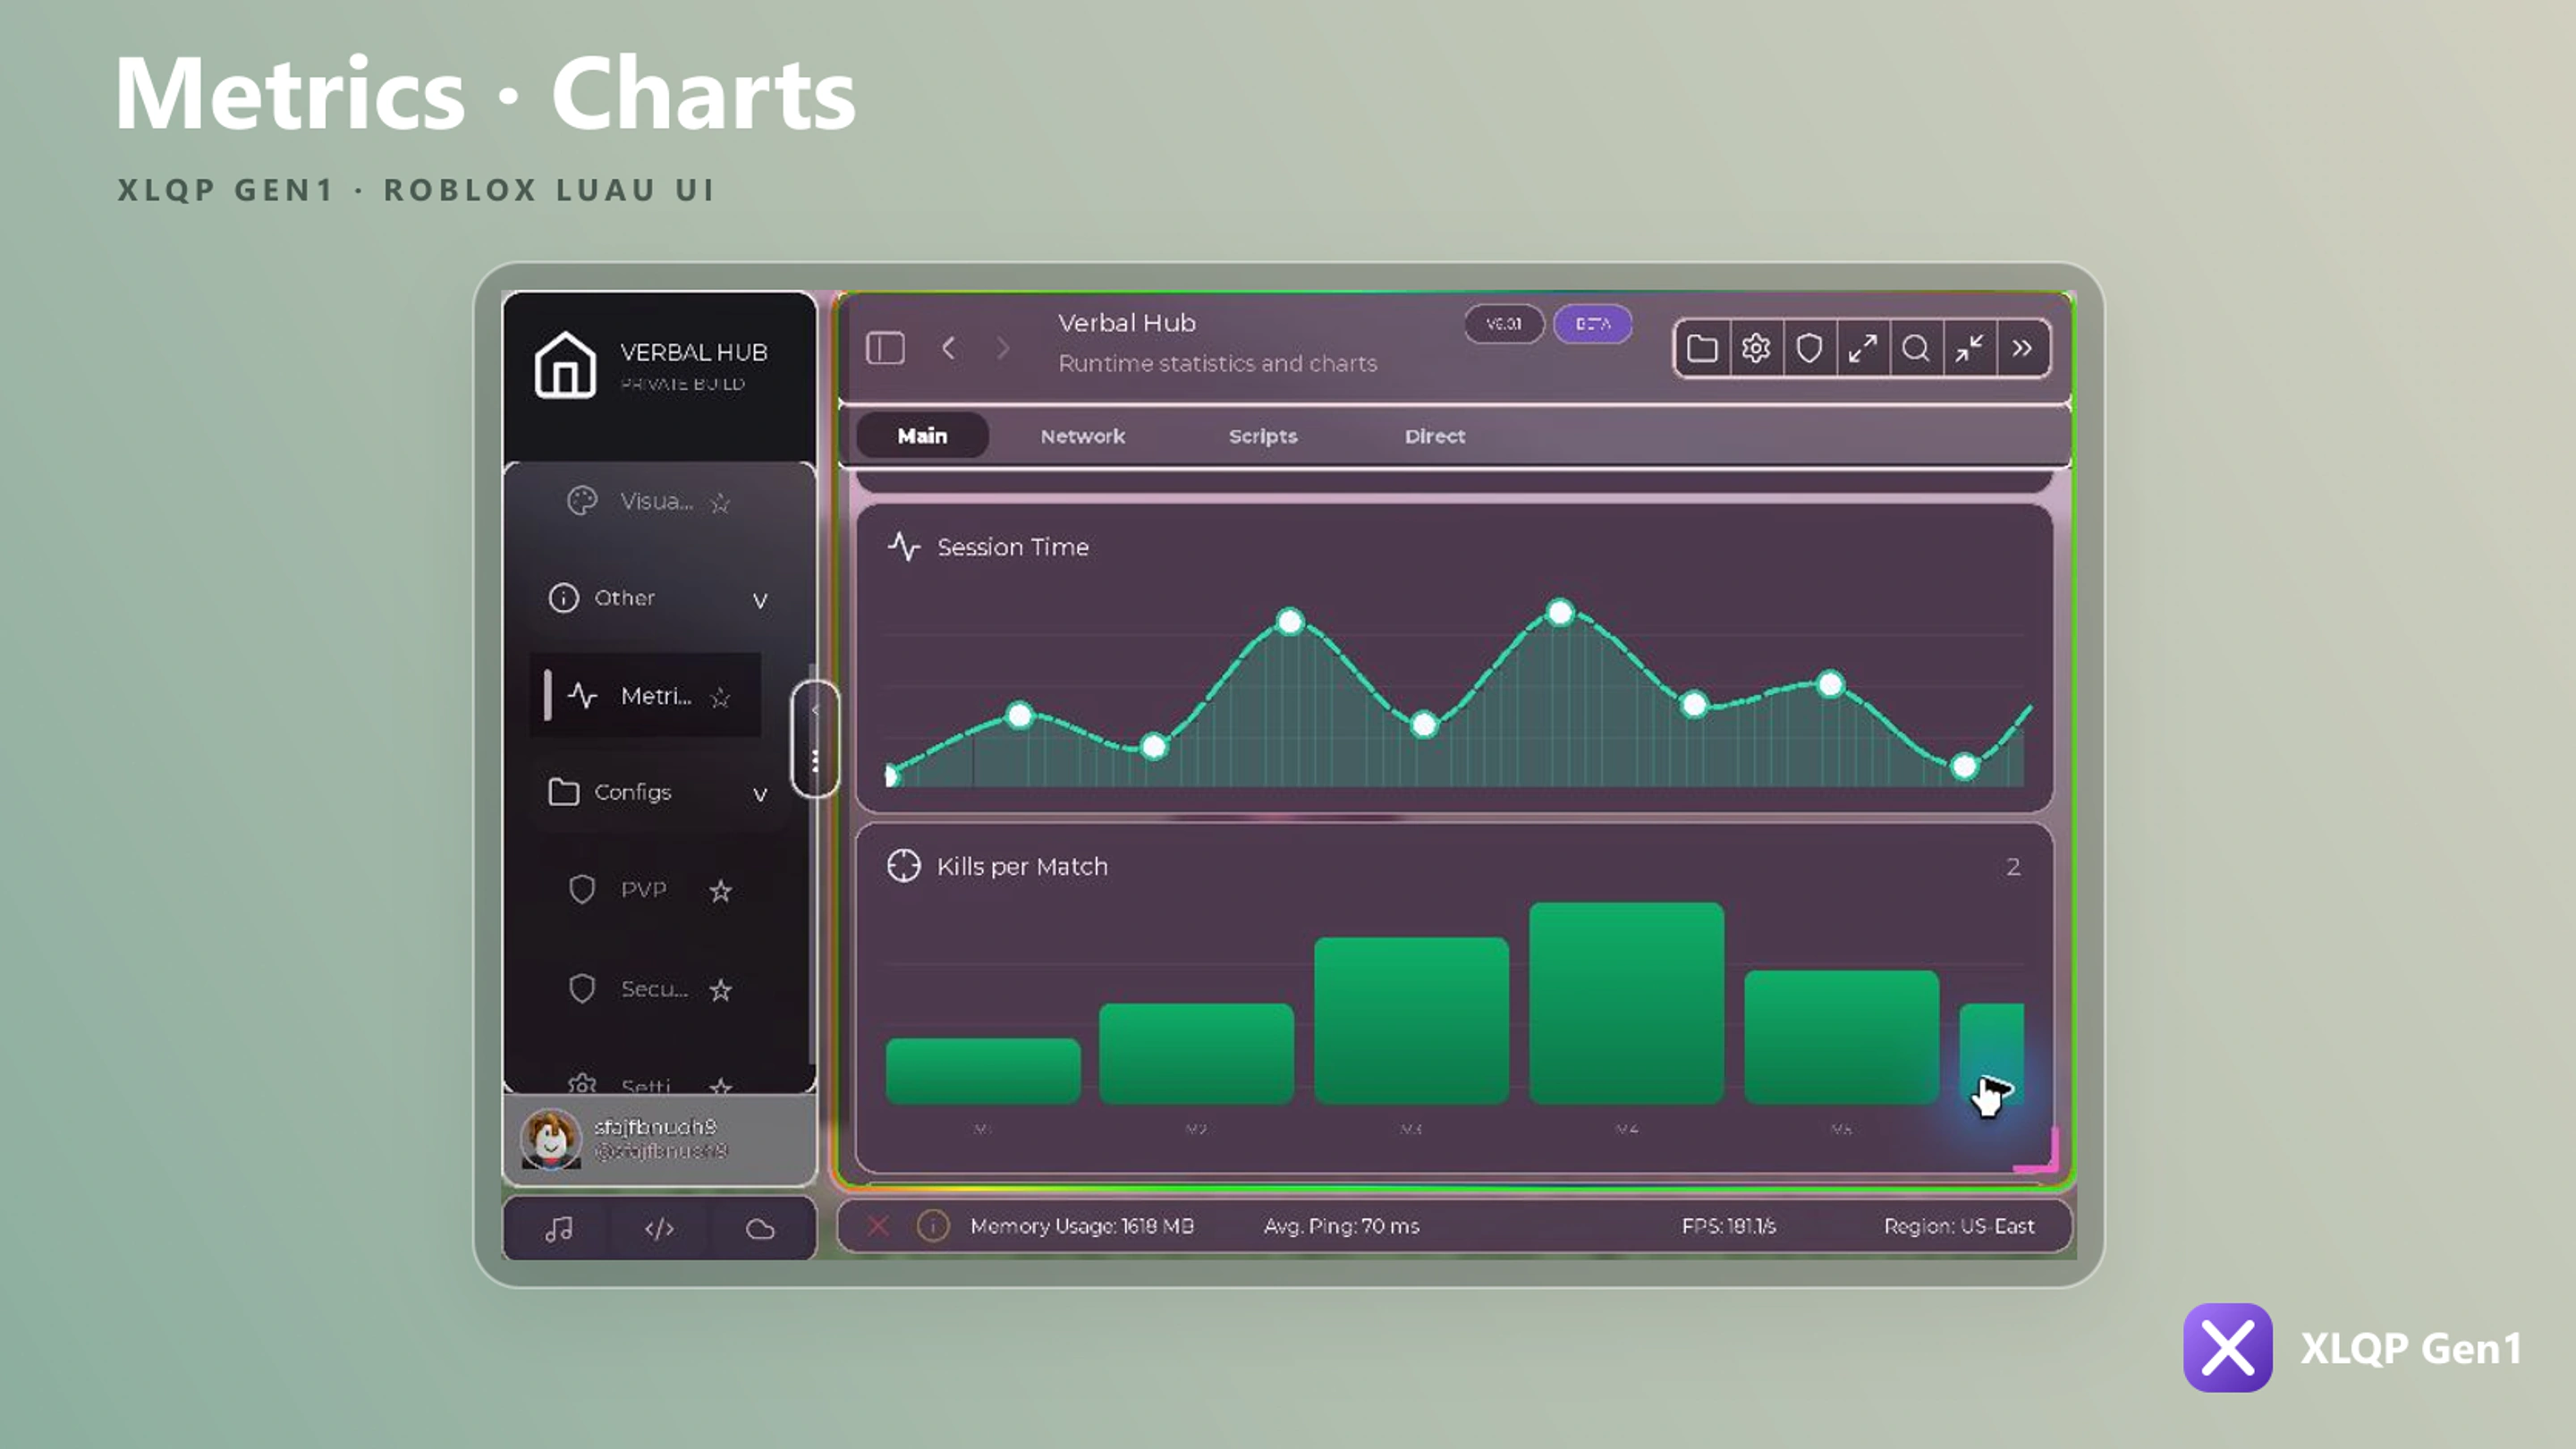
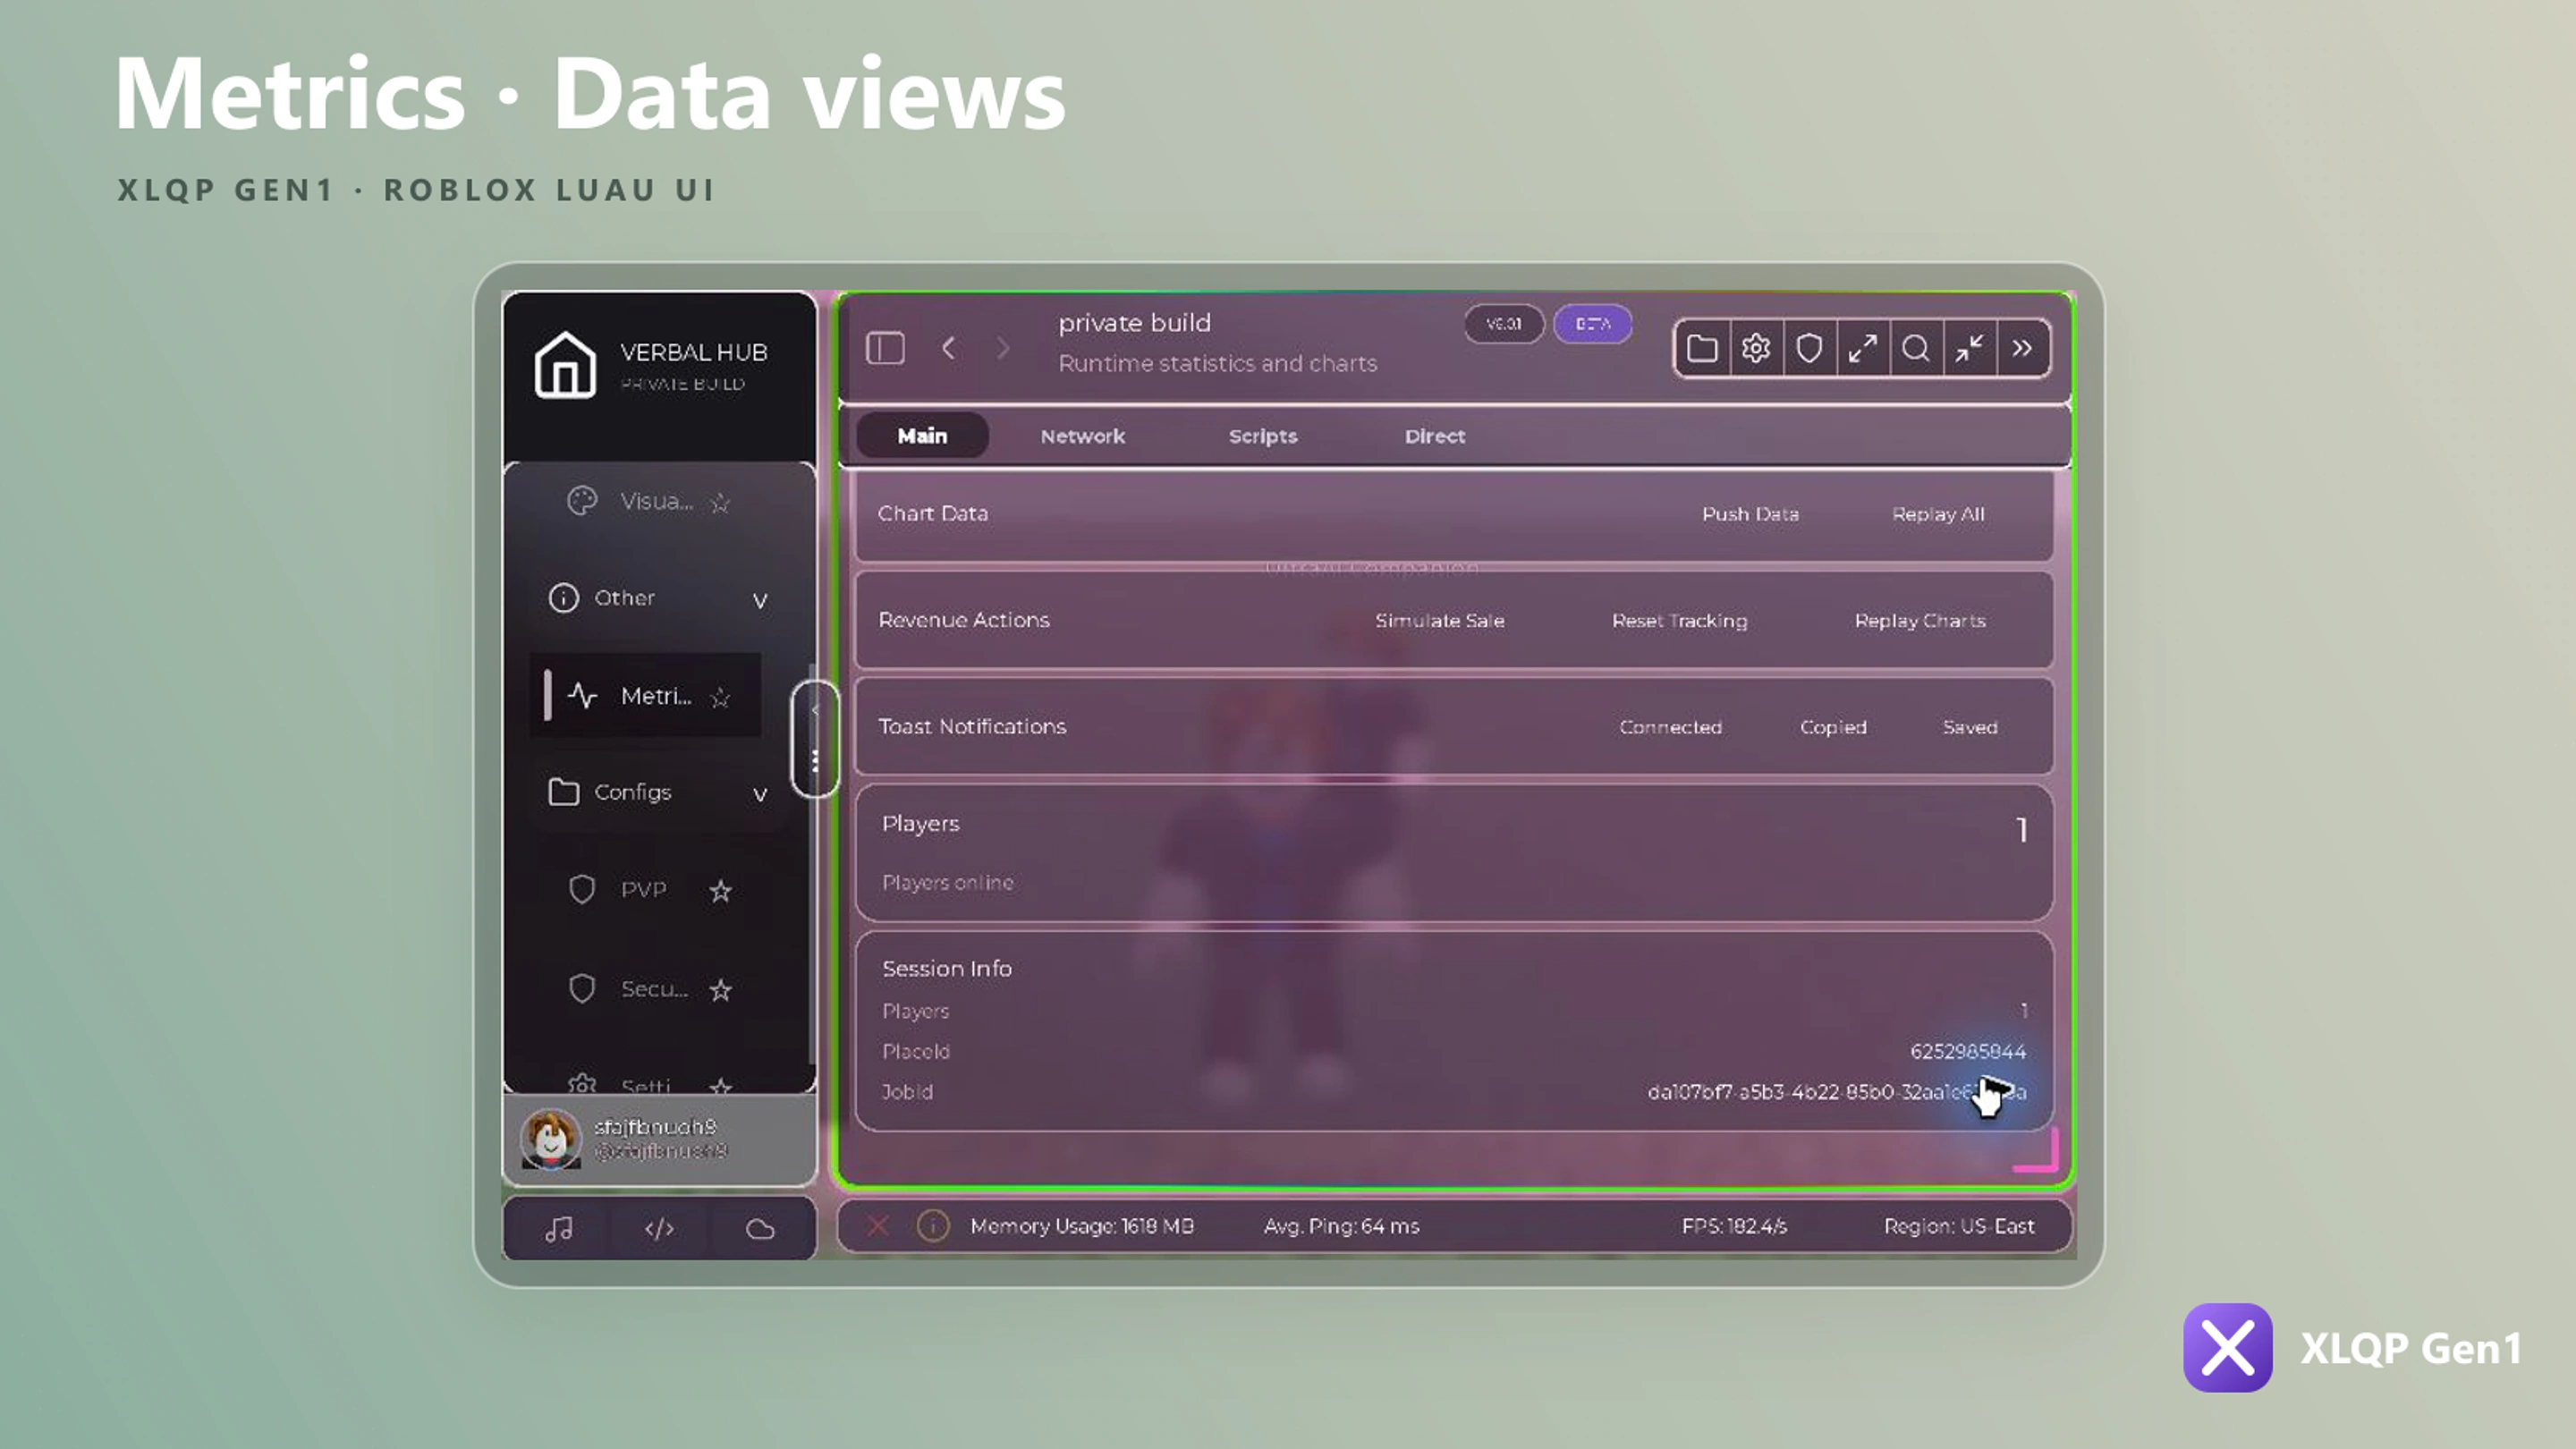
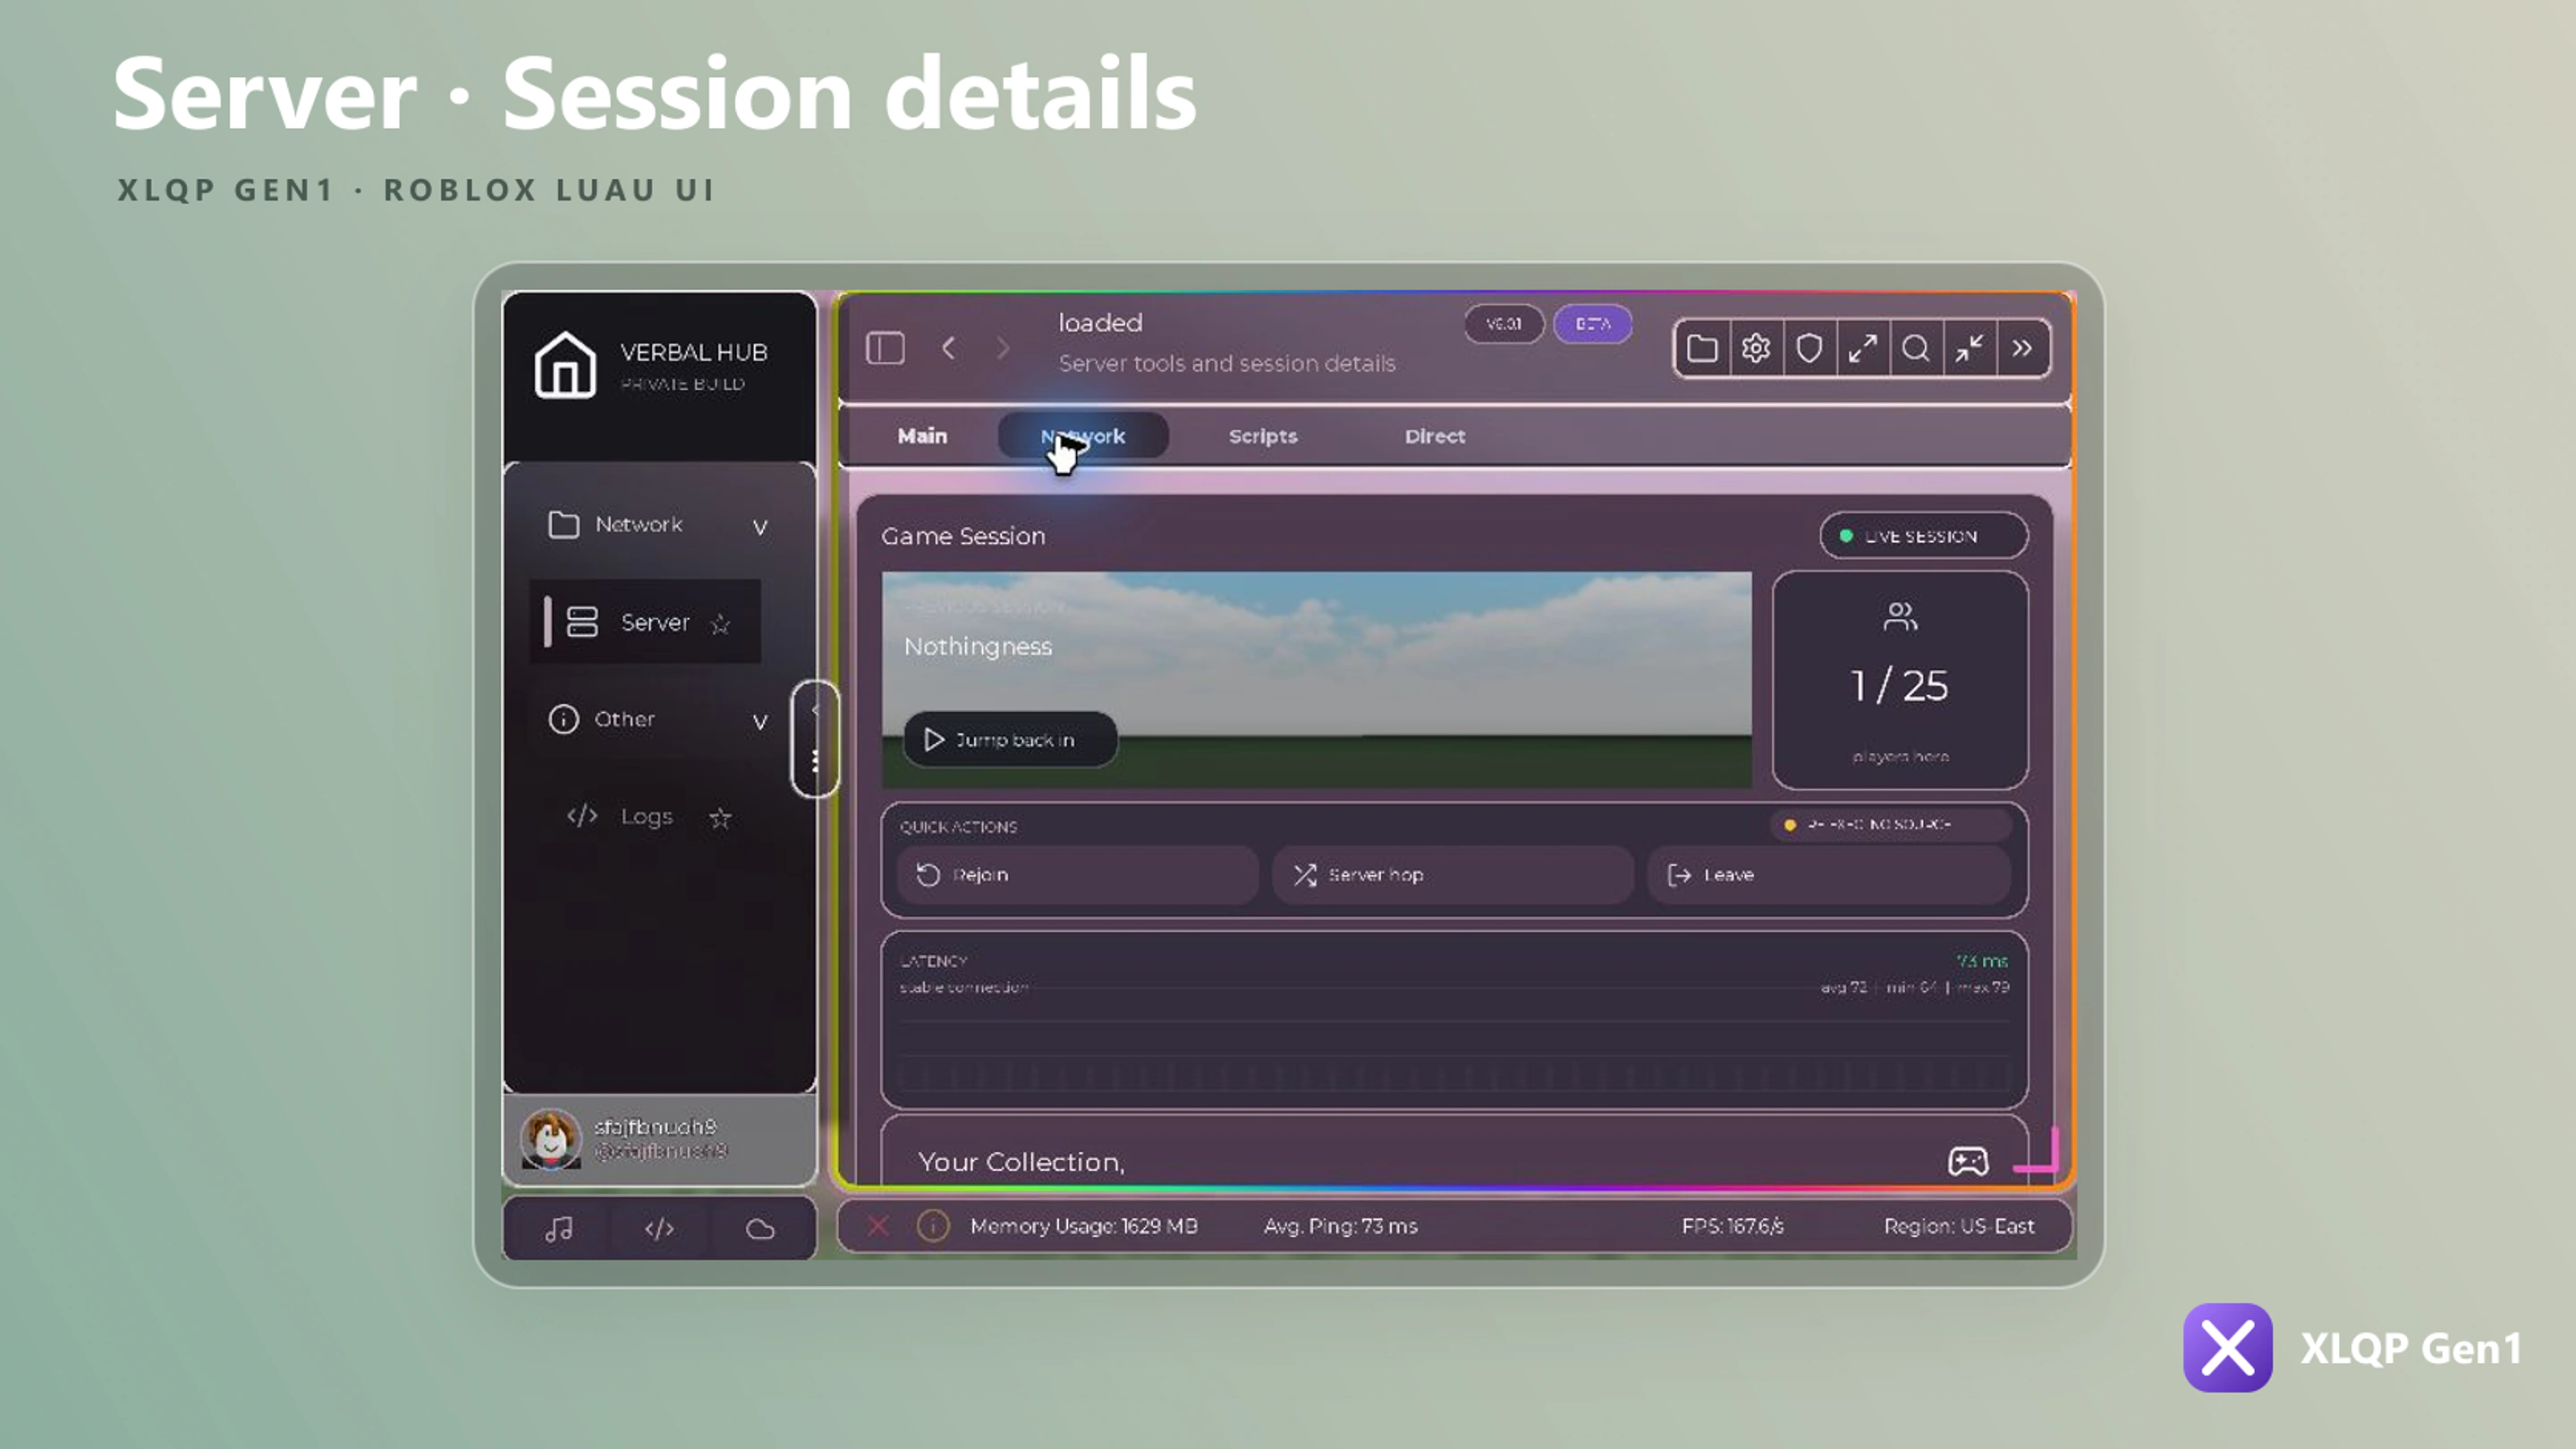
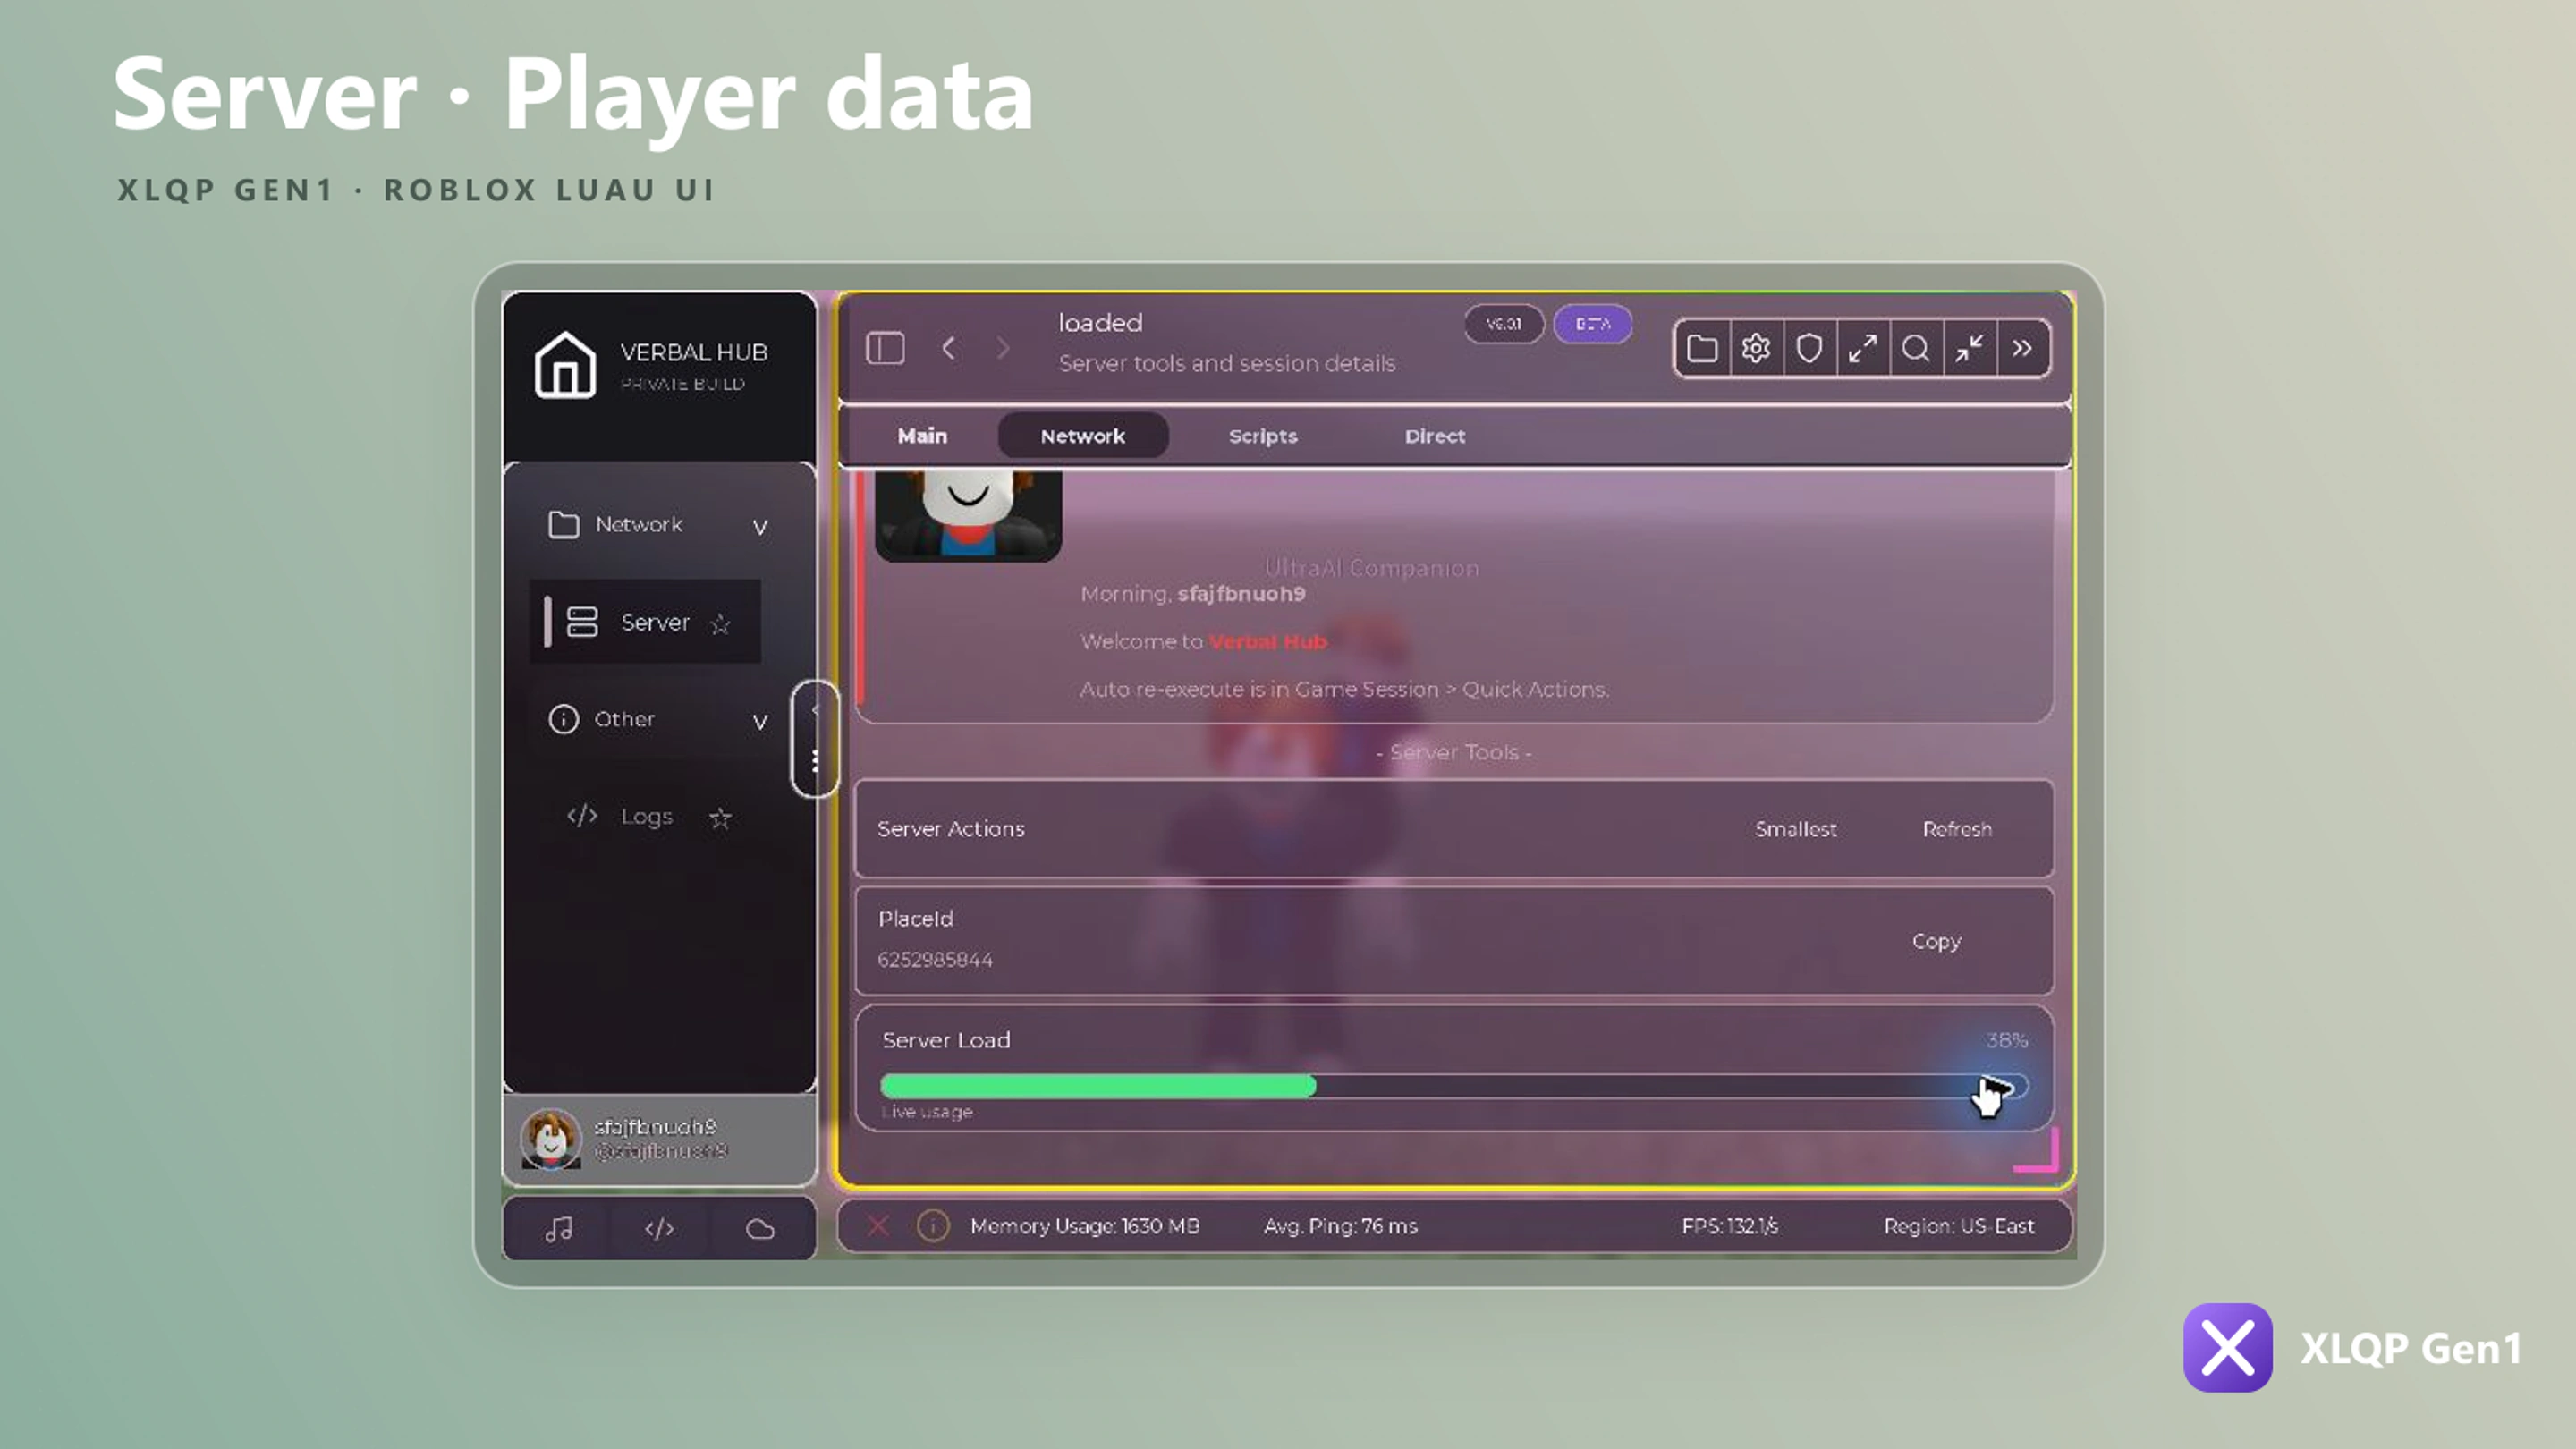
XLQP includes elements for presenting tables, time-series data, progress, and live session metrics.
Interface previews
Data table
local PlayersTable = Section:AddDataTable({
    Name = "Players",
    Height = 280,
    Searchable = true,
    SearchPlaceholder = "Search players…",
    Columns = {
        { Key = "name", Name = "Player" },
        { Key = "team", Name = "Team" },
        { Key = "distance", Name = "Distance" },
    },
    Rows = {
        { id = 1, name = "Alex", team = "Blue", distance = 24 },
        { id = 2, name = "Sam", team = "Red", distance = 51 },
    },
    Callback = function(row)
        print("Selected:", row.name)
    end,
})PlayersTable:AddRow({ id = 3, name = "Taylor", team = "Blue", distance = 12 })
PlayersTable:UpdateRow(3, { distance = 9 })
PlayersTable:RemoveRow(2)
PlayersTable:SetFilter("Blue")
PlayersTable:SortBy("distance")The controller also supports SetRows, Clear, and GetSelected.
Charts
local Chart = Section:CreateChart({
    Name = "Frame rate",
    Height = 220,
    Points = { 60, 58, 61, 60 },
    MaxPoints = 30,
    Color = Color3.fromRGB(139, 92, 246),
    Smooth = true,
    Filled = true,
    Suffix = " FPS",
})

Chart:Push(59)
Chart controllers can replay their animation; line and bar charts can also push new values.
Progress
local Progress = Section:AddProgressBar({
    Name = "Initialization",
    Description = "Preparing modules…",
    Min = 0,
    Max = 100,
    Value = 30,
})

Progress:Set(75)
Factory alternatives include CreateProgress, CreateProgressBar, and CreateDownloadProgress. Download progress provides Download, Pause, Resume, and Cancel.
Runtime monitoring
local Monitor = Section:AddRuntimeMonitor({
    Name = "Runtime",
    Interval = 1,
    AutoStart = true,
    Metrics = {
        { Key = "fps", Name = "FPS" },
        { Key = "memory", Name = "Memory" },
    },
})

Monitor:SetMetric("fps", 60)
Monitor:Refresh()
Use Start and Stop to control polling.
Revenue and statistics
local Revenue = Section:AddRevenueCard({
    Name = "Session earnings",
    Value = 1200,
    Prefix = "$",
    Change = 8.4,
    Color = Color3.fromRGB(52, 211, 153),
    Duration = 0.6,
})

Revenue:Add(250)
Revenue:SetChange(12.5)
AddRevenueCard also supports suffixes, decimals, icons, mini-stats, and chart binding. Use CreateStat or AddStatCard for smaller values.
Other data views
| Method | Purpose | Main options |
|---|---|---|
AddTableContents | Structured rows and columns | Columns, Rows, Height, Description |
AddMeterGroup | Multiple named meters | Items, Color |
AddPlayerCount | Live player count | Name, Description |
AddClock | Live formatted time | Name, Description, Format |
AddPlayerVisualizer | Player/world visualization | Player, Height, Boxes, LiveColor, callbacks |
AddKeybindList | Active bind display | Title, Width, Height, Detached, Pin |
Keep data refresh work lightweight and update only the controller whose value changed.